Report
Stack Console Reports Overview
Stack Console offers a wide range of monitoring, analytics, and operational reports that provide deep visibility into the platform's infrastructure and user activity. These reports are designed to assist cloud administrators, support teams, and DevOps engineers in efficiently managing virtual resources, tracking usage, maintaining system health, and ensuring seamless service delivery.
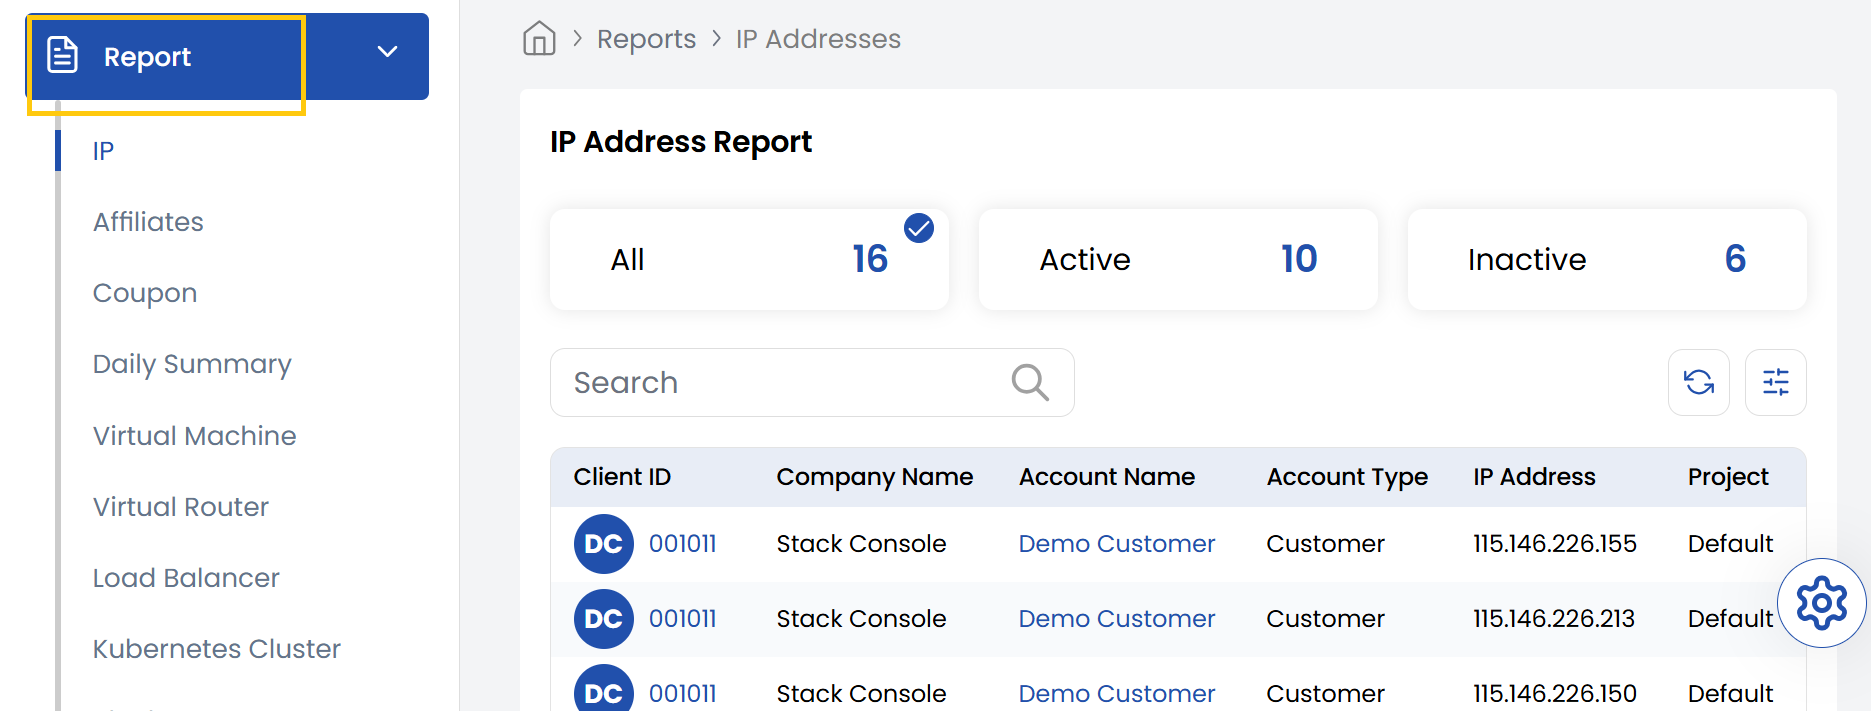
- From the left-hand side menu, select the Report tab. To view report of each resource navigate through the sub-sections under the Report tab.
Below is a comprehensive description of each report of resources available in the Stack Console:
-
IP Address Report:
Displays the total number of IP addresses provisioned in the system, including how many are currently active, inactive, or reserved. Useful for managing and auditing IP resource usage. -
Coupon:
Lists all promotional or discount coupons in the platform, categorizing them as active (valid and usable), inactive (expired or disabled), or total. Helps in managing marketing campaigns and discounts. -
Virtual Machine:
Shows all virtual machines created by users, along with their status: active (running) or inactive (shut down or stopped). Useful for resource tracking and capacity planning. -
Virtual Router:
Displays all virtual routers deployed in user environments, highlighting their operational status. Aids in network topology monitoring and troubleshooting. -
Load Balancer:
Lists load balancer instances along with their current status, helping monitor traffic distribution and service availability across applications. -
Kubernetes Cluster:
Shows all Kubernetes clusters that have been deployed, indicating their active or inactive state. Crucial for managing container orchestration environments. -
Block Storage:
Displays block storage volumes provisioned in the system, showing how many are in use (active) or unused (inactive). Useful for storage optimization and cost control. -
Block Storage Backup:
Lists backups taken of block storage volumes, indicating whether they are available, successful, or failed. Ensures data protection compliance. -
BS Snapshot:
Shows snapshots of block storage volumes with their status. Used for data recovery and version control. -
VNF Appliances:
Displays virtual network function appliances currently provisioned, along with their usage state. Supports management of network services in SDN/NFV environments. -
VM Autoscale:
Lists autoscaling configurations for virtual machines, showing which are active (currently scaling resources) and which are configured but inactive. -
VM Snapshot:
Shows snapshots taken from virtual machines, helping users recover or duplicate VM states. Includes status to indicate whether the snapshots are available. -
Object Storage:
Lists object storage buckets in use or inactive. Supports efficient management of unstructured data storage. -
Data Backup:
Shows data backups outside of block or VM backups, including manual or system-initiated backups. Useful for overall data protection tracking. -
Network:
Displays all configured virtual networks and their usage status. Helpful in managing network resources and planning future expansion. -
Client Feedback:
Shows feedback received from customers, tagged with review status. Useful for monitoring support quality and identifying areas for improvement. -
Veeam Backup:
Lists backup jobs managed through Veeam, showing job status and backup reliability. Helps ensure backup strategy consistency. -
Bandwidth:
Displays bandwidth consumption across resources and accounts. Essential for monitoring usage patterns and preventing overuse. -
DNS:
Lists DNS entries configured in the platform, showing whether records are valid and resolving properly. -
New Customers:
Provides a report on new customer sign-ups, order placements, and completed transactions, with year-over-year comparisons and filtering by year. -
Daily Summary:
Offers a daily view of operational activity including new and paid invoices, order status changes, and support ticket updates. Filterable by month for trend analysis. -
Resource Usage Report:
Displays quota usage per client, including CPU, memory, storage, IPs, networks, VMs, Kubernetes clusters, etc. Includes client details like ID and account type. -
Ticket Insights:
Shows staff performance on support tickets based on customer feedback and ratings over a selectable date range. -
System Error Log:
Logs backend errors triggered by user actions, including error details, associated username, provider (e.g., Cloud Stack), and timestamp. Helps trace and resolve platform issues efficiently.
Conclusion
The Report tab in Stack Console provides a robust suite of analytical tools to keep your cloud operations transparent and optimized. Whether you’re tracking infrastructure performance, reviewing user feedback, or ensuring billing and backups are aligned, these reports are essential for informed decision-making and operational efficiency.