Support Dashboard
Support Dashboard in Stack Console
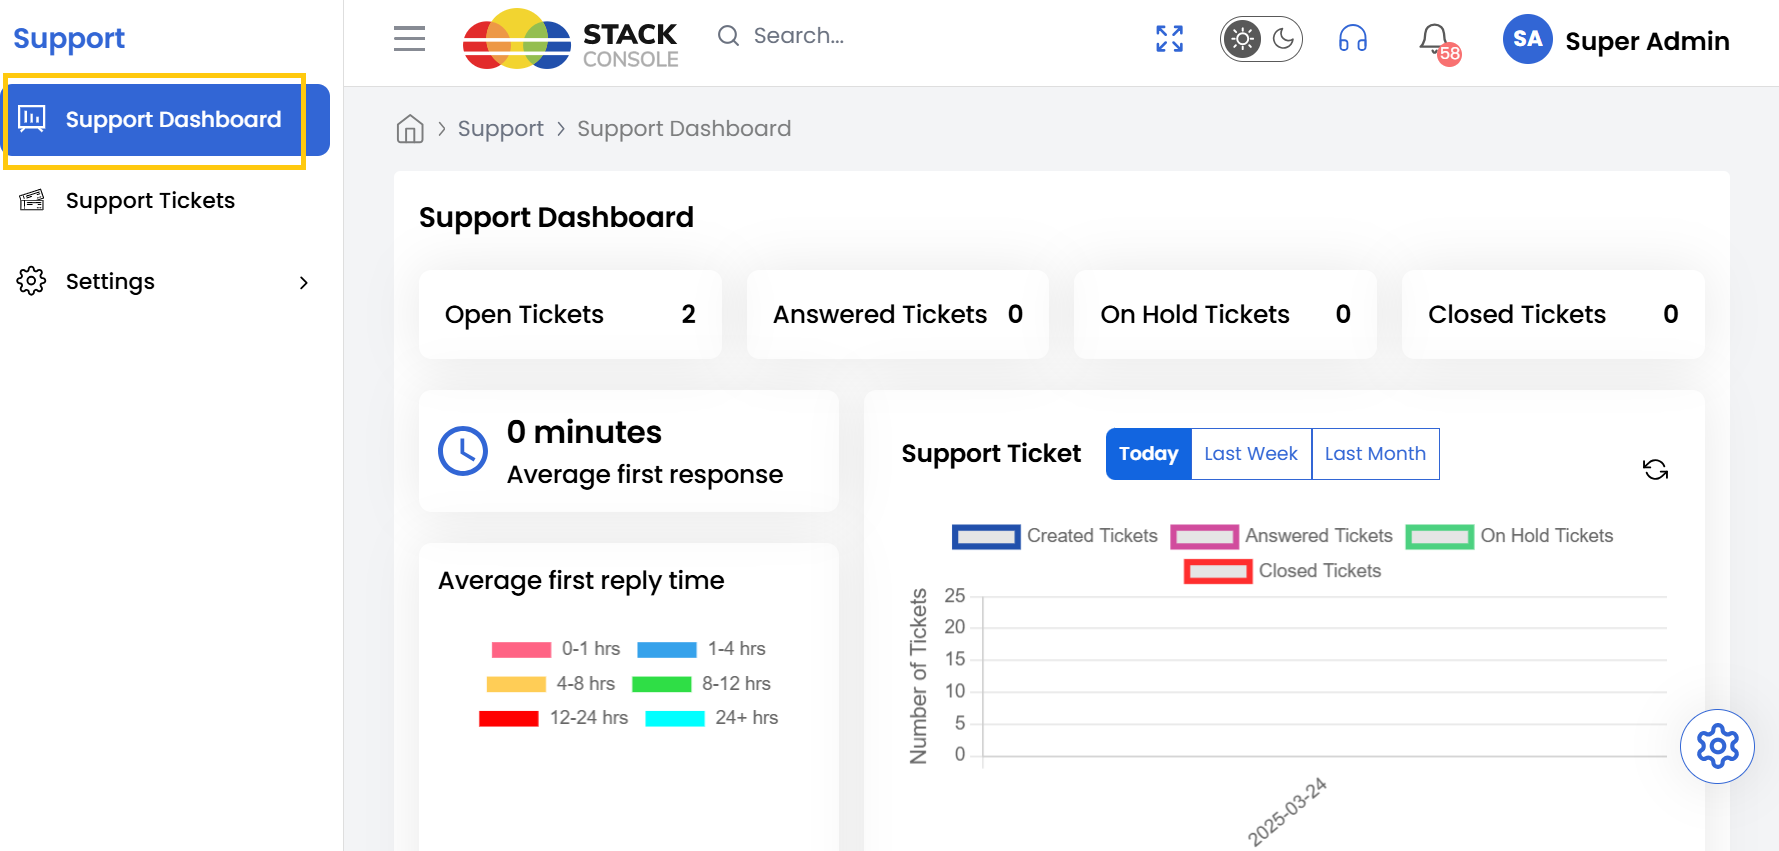
The Stack Console Support Dashboard is a centralized platform that allows support teams to efficiently manage customer inquiries, track ticket statuses, and monitor team performance. This document provides a detailed guide to navigating the dashboard, understanding its features, and performing key actions.
Accessing the Support Dashboard
- To access the Support Dashboard from the left-hand side menu, select Support tab. Click on Support Dashboard.
Support Tickets Status
-
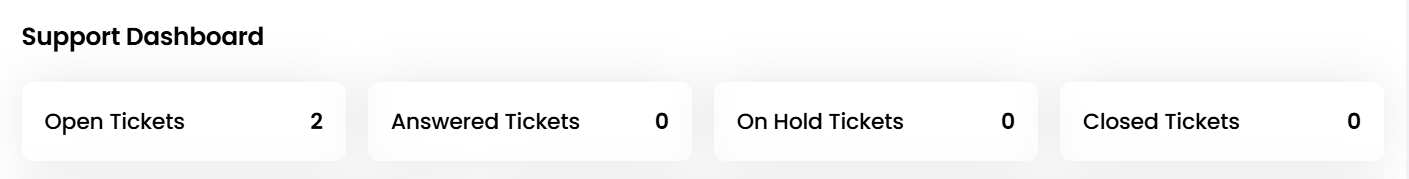
Upon accessing the Support Dashboard, you will find several key metrics and insights. The dashboard displays the following key ticket categories status:
- Open Tickets - Tickets that are currently active and awaiting resolution.
- Answered Tickets - Tickets that have received a response from a support agent.
- On Hold Tickets - Tickets that have been temporarily paused for further investigation or follow-up.
- Closed Tickets - Tickets that have been successfully resolved and closed.
Support Ticket Performance Metrics
-
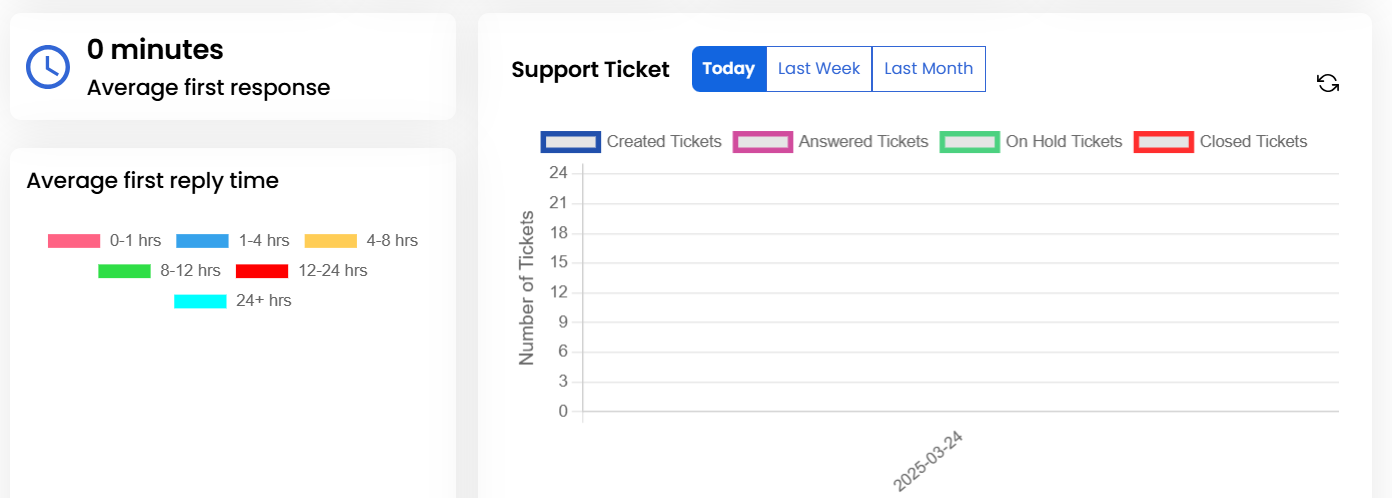
These metrics help teams measure responsiveness and improve customer satisfaction. In addition to ticket summaries, the Support Dashboard provides performance insights:
- Average Reply Time - The average time taken by support agents to respond to customer inquiries.
- Average First Response Time - The average time taken for the initial response after a ticket is created.
-
The dashboard also offers a timeline view, showing ticket activity trends. This feature allows us to track workload patterns, identify peak activity periods, and adjust resource allocation accordingly.
Conclusion
The Support Dashboard provides comprehensive visibility into your support operations, enabling efficient ticket management and performance tracking. By leveraging these insights, support teams can optimize response times, balance workloads, and deliver exceptional customer service.